How Does it Work?
Aircraft Passenger Emission Calculations
The following describes a methodological update currently in progress
As we do not have information on aircraft routes, it is necessary to estimate the distance the aircraft travels. Drawing upon the user input of source and destination airports, we estimate the great circle distance between the aerodromes (the shortest distance between two points on the surface of a sphere).
To do so, the co-ordinates of the inputted airports are sourced from the Global Airport Database and the distance between them is calculated using the Spherical Law of Cosines. These distances are calculated (in km) using a radius from the centre point of the Earth to the surface (6,378.137 km). Though this is invariably an underestimate due to uplift and any route inefficiencies, there is no need to apply a correction factor as this will be accounted for in the emissions factors used.
The journey is then categorized into domestic (flights that start and end in the United Kingdom, including the Isle of Man, but excluding the Channel Islands and Gibraltar), short range (within Europe), or long (beyond Europe) range.
To calculate emissions per passenger, the great circle distance is multiplied by an emissions factor. The emissions factors are sourced from the Government Department for Business, Energy & Industrial Strategy (BEIS), who provide aviation passenger emissions factors for domestic, short and long-haul flights.
The specific emissions factors used are for an average passenger (rather than economy or business class specifically) and for CO2. However, they include the indirect effects of non-CO2 emissions as per BEIS' recommendation. As such, they incorporate a 90% increase in CO2 emissions to approximate the indirect impact of non-CO2 emissions from aviation (such as water vapour, contrails and NOx). All the factors include the distance uplift of 8% to compensate for planes not flying using the most direct route (such as flying around international airspace and stacking). The emissions factors also account for the passenger load factor, a measure of capacity utilization. Should social distancing be implemented on aircraft, one should assume their carbon footprint is higher. The factors used are currently the 2022 ones, and these will be updated routinely.
Should the user enter any additional legs of the journey, this process is repeated for these legs and the sum is taken. If the user selects a return journey, the output is doubled.
The model does not have any knowledge of flight schedules and services, and so it is not possible for us to suggest more direct routes between locations. As a result, where aircraft routes are indirect (i.e. the journey goes via one or more additional airports) we compare the length of the chosen and direct route in order to determine the saving that would be achieved if a direct flight were taken. Where this saving is substantial, it likely (though not certain) that a more direct route will be available.

Car Routing and Emission Calculations
Car routing is undertaken using Google Maps. Once a route is calculated, the length of the journey is measured, and then an emissions factor is applied to estimate the emission.
The emissions factor applied here assumes a medium-sized car, should you be driving a smaller classification of car (such as a mini) assume the carbon footprint to be slightly lower. If the car is larger, assume the footprint to be slightly higher.
The BEIS emissions factor for medium-sized cars is 0.1743 kgCO2/km (unknown engine type). As we do not ask the user to input the car engine type, we use the unknown engine type emissions factor. For electric vehicles, the BEIS factor of 0.04777 kgCO2/km is drawn upon, assuming a medium-sized car type. Estimates are given for the whole car. Should you be sharing a car, the footprint should be divided by the number of passengers.
It is not possible to drive a car or motorcycle through the Channel Tunnel. Instead, motorists must drive onto the Eurotunnel Le Shuttle train. As such, if a car journey includes the Eurotunnel, and based on work by the Carbon Trust for the Eurotunnel Group, 2 kg CO2 is added for this portion of the journey irrespective of car type.
If a car journey includes a journey on a ferry, the BEIS emissions factor of 0.12774 is applied to this portion of the journey.
Rail Routing and Emission Calculations
Rail routing is undertaken using data extracted from OpenStreetMap using Osmosis and OSM2PO, and stored in a PostgreSQL database using the PostGIS extension. Routes are calculated using the Dijkstra’s algorithm, which is provided by PGRouting. When an air journey is submitted to the website, the software selects the nearest train station to the start and end airport, and tries to find a route along the rail network between the two. Note that the system has no knowledge of rail schedules or services, and so has to make the assumption that it is possible to get a train between any two stations that are linked by a track. For this reason, the route that we use might not always reflect the reality of available services, and we will occasionally identify routes that are not possible in reality.
Once a route is calculated, the length of the journey is measured, and then an emissions factor is applied to estimate the emission. Emissions factors are taken from BEIS. A factor of 0.0351 kgCO2/passenger km is applied for national rail, and a factor of 000441 kg CO2/passenger km is applied to international rail (Eurostar). Whilst the national rail factor is used most often, the tool checks to see if the journey includes the Eurostar network, and if it does then the international rail factor is applied.
The Map
Drawing a map is always a trade-off between appearance and functionality. The process of drawing the part of the Earth (a 3D shape) onto a flat surface such as a screen or page (a 2D shape) surface is known as map projection, which leads to inevitable distortions (changes in shapes, areas and/or distances on the map) in order to ‘flatten’ it. The results of these distortions can be quite misleading, and so it is important that care is taken to choose a suitable projection for a given map.
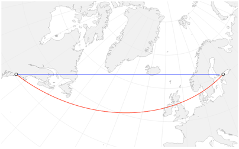
In this case, we want to illustrate the difference in length between different journeys on a map. Consider, the two maps below, both of which have the same lines: one in blue, which takes the shortest distance between the two points, and one in red, which takes a longer route in which a constant direction is maintained. In the map on the left (known as an orthographic projection), the direct route between the two points is correctly shown as being shortest (in blue). In the right hand-map, however, which uses a Mercator projection (similar to that used by services such as Google Maps), you can see that the resulting distortion makes the red line look like the shortest, which is incorrect!
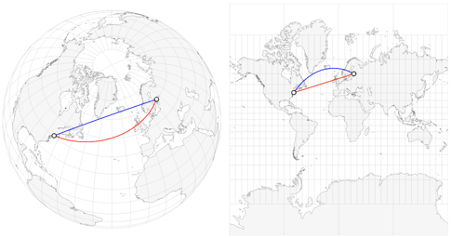
One solution to this problem would be to use the left-hand map (the orthographic projection) on our website. However, this approach has another limitation: it can only show half of the Earth’s surface at once, which is not very helpful if we want to map, for example, a journey from the UK to Australia.
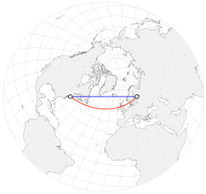
Our solution is therefore to use a special projection known as a Two Point Equidistant projection (below, right), which distorts the map in such way as to preserve distances from the start and end points of a journey (meaning that the lines are the correct length). This means that the journeys plotted on our map will be as representative of their true distance as possible, as well as capable of mapping long-haul flights that cover more than one hemisphere. To make the map as clear as possible on the website, we ‘zoom in’ to focus on the journeys, with the straight line distance between the start and end point running left to right in the middle of the image:
Our maps are drawn as SVG elements using the excellent d3-geo extension to the D3 (Data Driven Documents) JavaScript library.